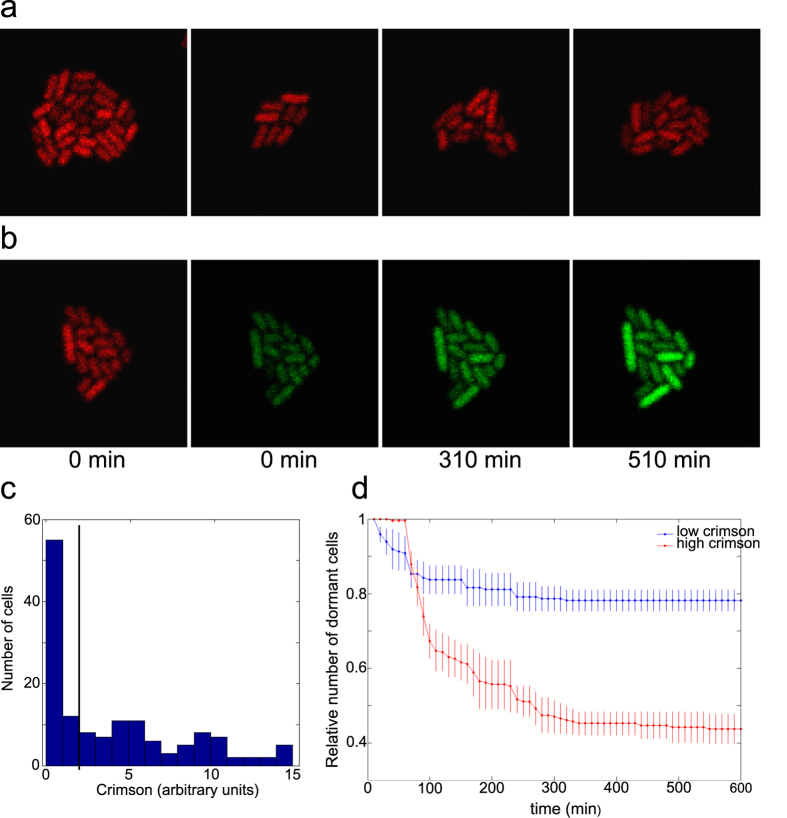
Figure 3. Microscopy analysis of growth resumption.
(a) Examples of microcolonies exhibiting heterogeneous Crimson staining. (b) Growth resumption in microcolony after addition of gluconate and GFP inducer (IPTG). (c) Distribution of Crimson expression levels at 0 h timepoint. Black line separates low and high Crimson populations. (d) Growth resumption of cells with low and high Crimson content. Cells were grouped according to their Crimson expression levels at 0 h timepoint. Values are an average from three independent experiments and error bars indicate s.e.m. Time-courses were analysed using linear regression t-test in Graphpad software package and found to be significantly different from each other (p < 0.0001).

