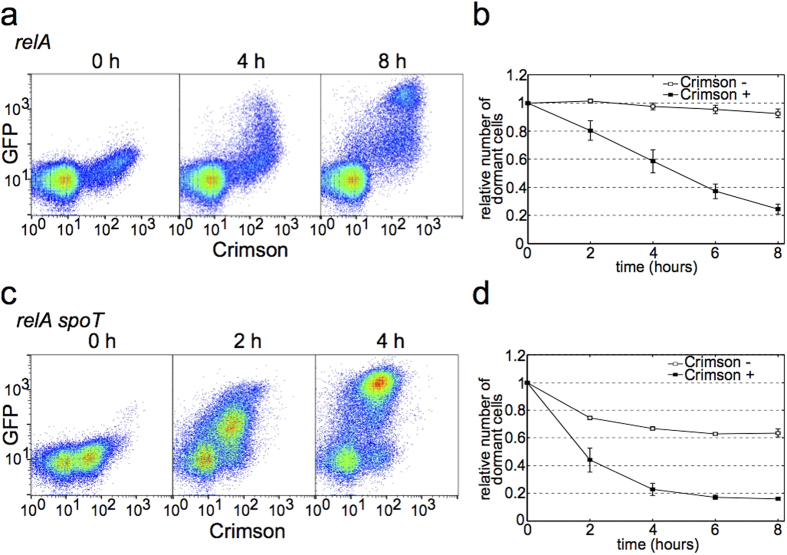
Figure 4. Growth resumption of strains with altered (p)ppGpp levels.
(a) Stationary phase distribution of Crimson expression (0 h) and growth resumption in ΔrelA strain. The distribution of Crimson expression in stationary phase is bimodal (Hartigan’s dip test for unimodality, D = 0.0104, p < 2.2 × 10⁻¹⁶). (b) Growth resumption timing correlates with Crimson expression levels in ΔrelA strain. Time-courses were analysed using linear regression t-test in Graphpad software package and found to be significantly different from each other (p < 0.0001). (c) Stationary phase distribution of Crimson expression (0 h) and growth resumption in ΔrelA ΔspoT strain. The distribution of Crimson expression in stationary phase is bimodal (Hartigan’s dip test for unimodality, D = 0.0175, p < 2.2 × 10⁻¹⁶). (d) Growth resumption timing correlates with Crimson expression levels in ΔrelA ΔspoT strain. Time-courses were analysed using linear regression t-test in Graphpad software package and found to be significantly different from each other (p < 0.0001). Values are an average from three independent experiments and error bars indicate s.e.m.

