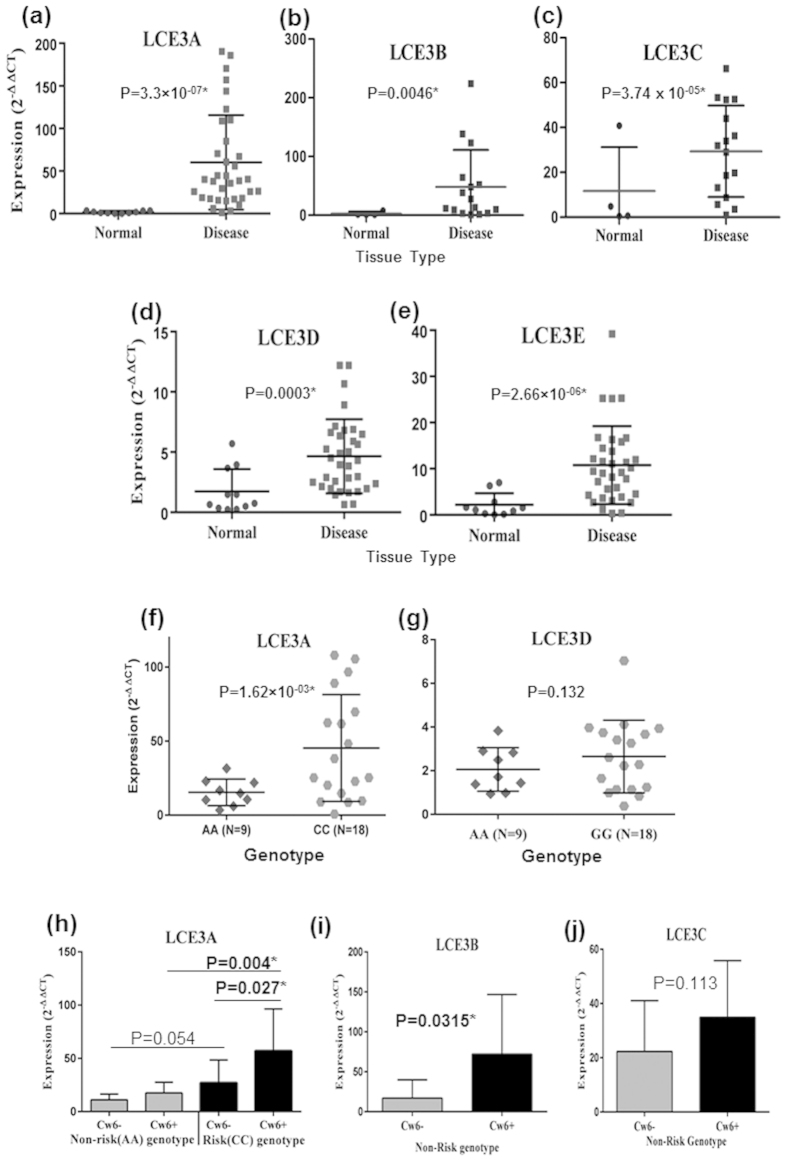
Figure 1. Expression profiling of LCE3 genes.
(a–e) Expression pattern of five LCE3 genes in psoriatic and adjacent normal skin. All five LCE3 genes were significantly upregulated in psoriatic skin. (f–g) Variation in expression pattern from diseased tissue with respect to genotypes of LCE3 genes. Only LCE3A expression was significantly upregulated with risk genotype. (h–i) Expression pattern of LCE3 genes with respect to genotype and HLA-Cw6 status. Only LCE3A showed significant difference between homozygous non-risk and risk genotype in presence of HLA-Cw6. Error bars represents the Standard deviation.

