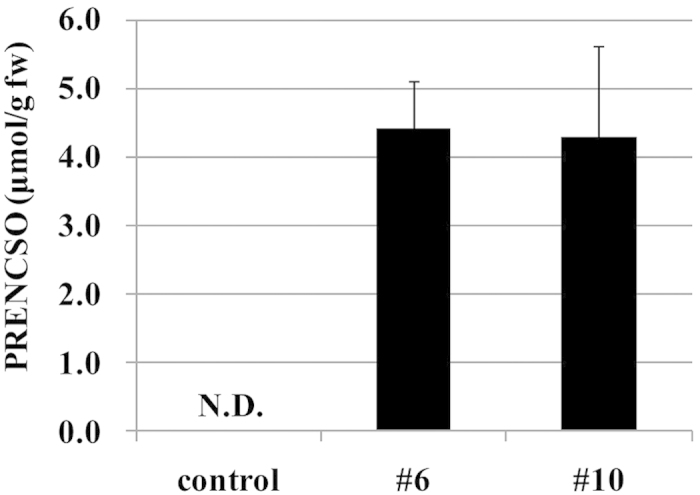
Figure 5. Analysis of PRENCSO in unheated onion bulbs (control, #6 and #10).

PRENCSO concentrations are presented as μmol per g fresh onion weight. The control represents the normal onion (‘Sapporo-Ki’) grown in the same field, the same cultivation method as #6 and #10. Data are mean ± SD, n = 2 (control), n = 8 (#6) and n = 9 (#10). N.D., not detected.
