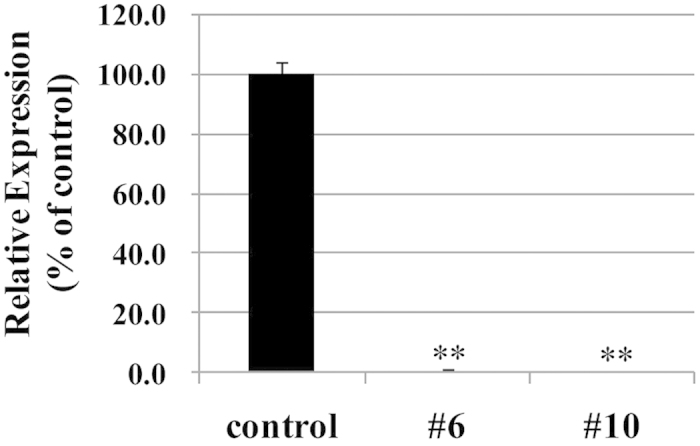
Figure 7. Analysis of alliinase mRNA levels in onion bulbs (control, #6 and #10).

The mRNA expression levels of alliinase were quantified by real-time PCR. The expression levels are normalized to the amount of ubiquitin transcript and presented in percentage relative to the mean expression level in the control bulbs. Data are mean ± SD, n = 3 (each sample). Significant differences between control and the test samples by Dunnett’s test (P < 0.01,) are indicated by **.
