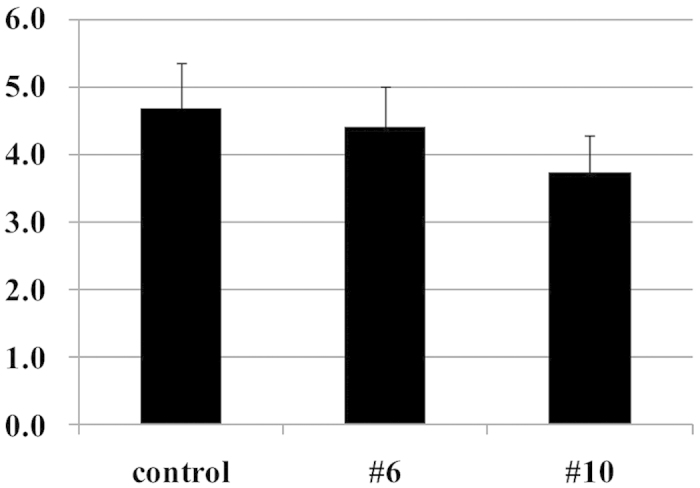
Figure 8. Soluble Solids measured in onion bulbs (control, #6 and #10).

The control represents the normal onion (‘Sapporo-Ki’) grown in the same field and by the same cultivation method as #6 and #10. Data are mean ± SD, n = 5 (control), n = 19 (both #6 and #10). No significant differences were observed between control and the test samples (#6, #10) by Dunnett’s test.
