
Figure 2.
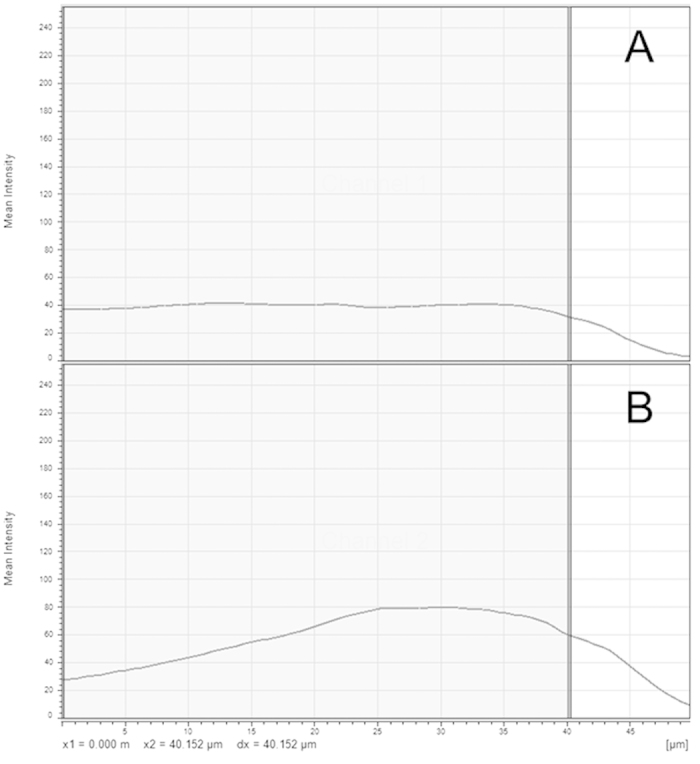
(A,B) Representative mean intensity chart. (A) represents the mean intensity through the z-stack for DAPI. (B) represents the mean intensity through the z-stack for WGA-AF488. The X axis represents the depth through the section (z-stack), the Y axis is the mean intensity per channel at each depth (frame of the z-stack).