
Figure 3. Selected XRD patterns of Sb2S3 at various pressures pressures (λ = 0.4246 Å, T = 300 K).
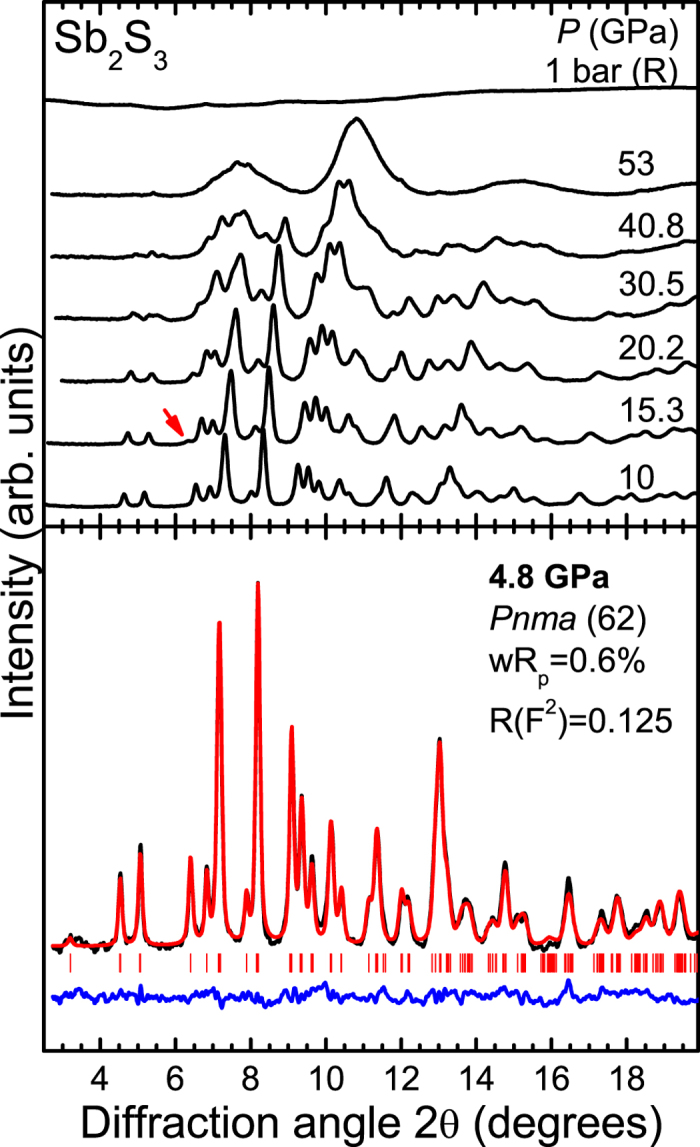
The red arrow marks the new Bragg feature. An example of a Rietveld refinement at 4.8 GPa is also provided. The black and red solid lines correspond to the measured and the fitted spectra, whereas their difference is depicted as a blue line. Vertical ticks mark the Bragg peak positions for the Pnma phase.