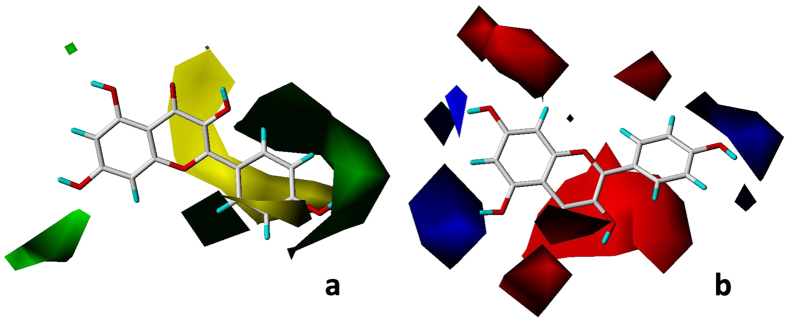
Figure 2.
CoMFA-CSE contour maps based on kaempferol 14, (a) steric field. Green contours indicate regions where bulk is favorable and yellow contours are areas where bulk is unfavorable; (b) electrostatic field. The blue region refers to the area where an electropositive group is favorable, while, the red region represents the area where an electronegative group is favorable.

