
Figure 2.
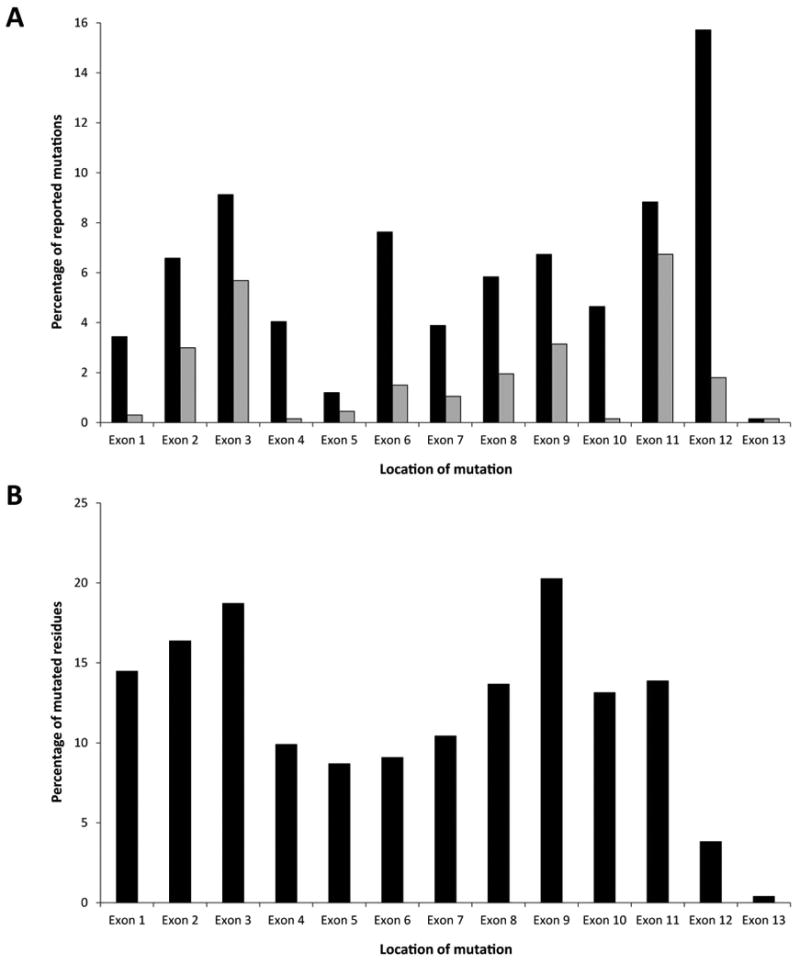
A) Distribution of reported exonic mutations across the BMPR2 gene. Black bars represent all mutation categories; grey bars indicate missense mutations only. This graph excludes data from non-coding regions and gene rearrangements for which start and/or end points have not been conclusively determined. B) Proportion of distinct point mutations relative to exon size. Multiple and/or recurrent variants at the same nucleotide were counted as a single event. The total number of mutated residues confined to the open-reading frame was calculated as a percentage of exon length in nucleotides.