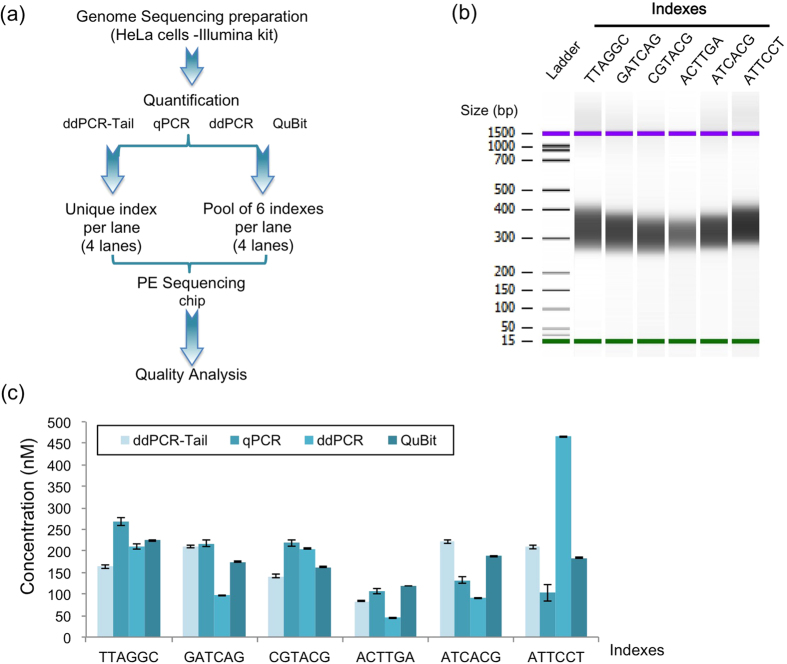
Figure 2. Comparison of four titration techniques for NGS.
(a) Diagram of the Next generation sequencing (NGS) experimental design. Using four quantification methods, we titrated DNA libraries prepared from HeLa cells, following manufacturers’ instructions. Six different indexes were added at the amplification step. Of the eight lanes on the NGS flowcell, four lanes were used to compare each method (unique index lane) and four lanes for pooling accuracy (pool of six indexes per lane). (b) Bioanalyzer image of the libraries, showing a homogenous smear of DNA from 280 to 450 bp. All six indexes show similarly average sizes. (c) Result of the quantification for all indexes using QuBit, qPCR, ddPCR and ddPCR-Tail approaches, respectively. All quantifications (except ddPCR-Tail) were done following manufacturer instructions (Invitrogen, BioRad, and KapaBiosystem). The ddPCR-Tail strategy used the same apparatus as the ddPCR with slight modifications (50 nM primers; three-step PCR-annealing at 65 °C for 30 seconds, extension time of 30 seconds at 72 °C). Experiments done in triplicate, mean calculated using dilution curve (average of 12 values per quantification, 6 for QuBit). Mean ± SD shown.

