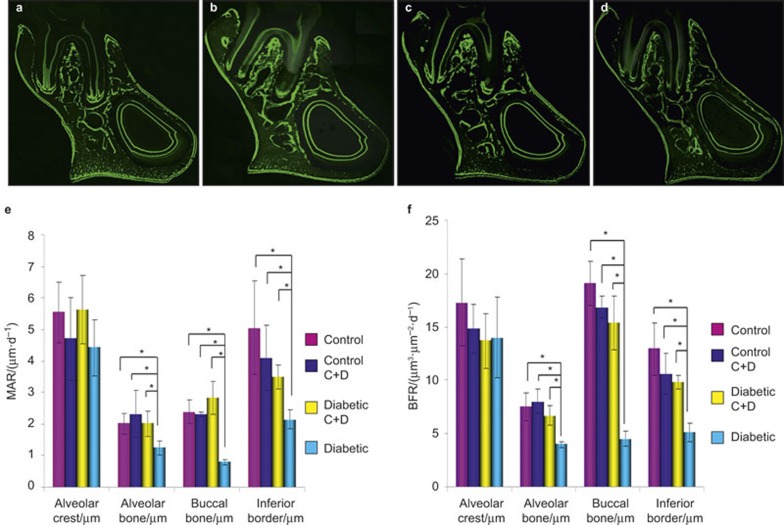
Figure 2.
Frontal sections of the mandibular second molar area. (a) The control group; (b) the control C+D group; (c) the diabetic C+D group; (d) the diabetic group. Fluorescent labelling on the periosteal surface indicates new bone formation. (e) The changes in the MAR in regions 1–4 of the mandible among all groups. The data are expressed as the mean ± SD. n = 10 for each group. *Significant difference (P < 0.05). (f) The changes in the BFR in regions 1–4 of the mandible among all groups. The data are expressed as the mean ± SD. n = 10 for each group. *Significant difference (P < 0.05). BFR, bone formation rate; MAR, mineral apposition rate; SD, standard deviation.

