
Figure 1.
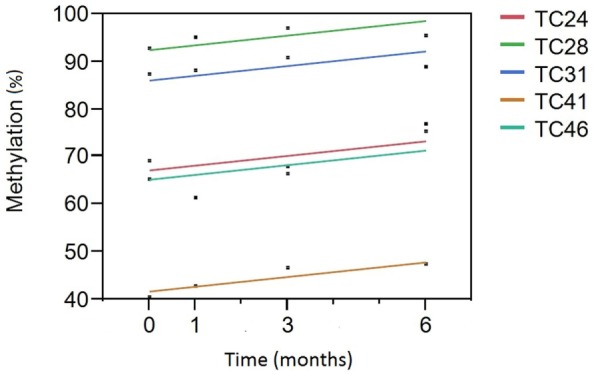
A Plot of cg05575921 methylation as a function of time from smoking cessation intake/quit point. Percent methylation, as indicated by the qPCR assay, is given on the Y axis. Time (in months) of the blood draw relative to the inception of the subject into the study and hopefully their efforts to reduce smoking is given on the X axis. Each of the subjects had negative cotinine and exhaled CO levels at the 3- and 6-month time points. The linear fit of the reversion curve for each subject is denoted by the color in the figure legend. For example, the best fit line for tobacco cessation (TC) subject 31 (TC31) is shown in blue.