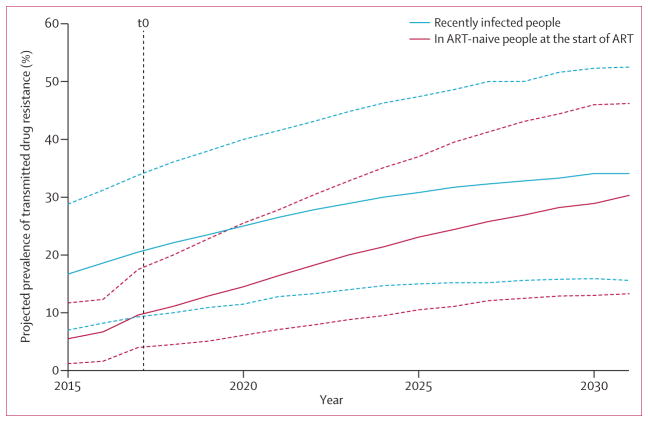
Figure 1. Projected trend over time in transmitted drug resistance to NNRTIs.
Projected trend in prevalence of transmitted drug resistance to NNRTIs over 15 years in recently infected people (blue lines) and in ART-naive people at the start of treatment (red lines) with no change in policy, restricted to programmatic scenarios in which t0 levels of NNRTI resistance in ART-naive people at the start of treatment are less than 10%. The t0 level of NNRTI resistance in people starting ART is calculated as the mean over all four quarters of the year 2016. The plotted values are the median (solid line) and 90% range (dotted line) over all quarters and all programmatic scenarios for every given year (which is why the upper 90% limit is higher than 10% at t0). ART=antiretroviral treatment. NNRTI=non-nucleoside reverse transcriptase inhibitor.

