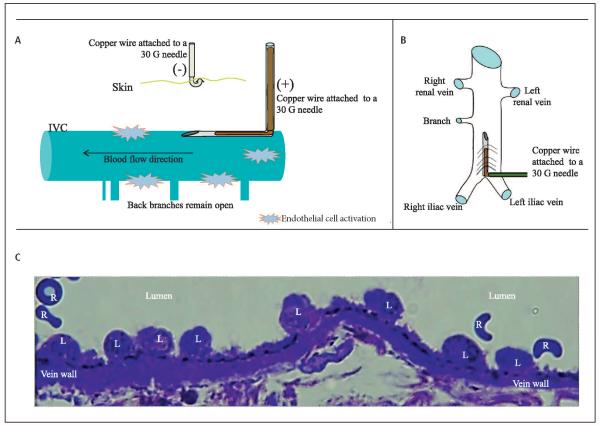
Figure 1. EIM.
A) Schematic representation of the endothelial activation during EIM (lateral view). B) Schematic representation of the IVC with the needle inserted (anterior view). C) Leukocytes aligned to the endothelial surface minutes after EIM, indicating preserved and activated endothelial cells within the IVC, as we previously described (14, 15). L: leukocyte; R: red blood cell.

