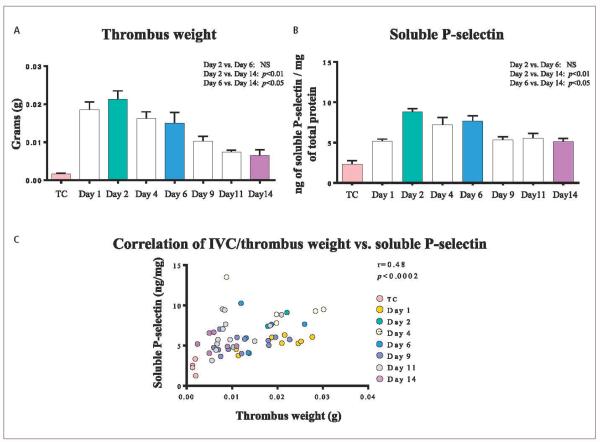
Figure 3. Thrombus weight, soluble P-selectin levels and its correlation.
A) Thrombus weight showing a maximum size at day 2 and a decrease over time. B) The plasma soluble P-selectin shows maximum levels at day 2 and a consistent decrease through day 14. C) Thrombus weight and soluble P-selectin correlation: A strong positive correlation between thrombus weight and soluble P-selectin was observed. TC: true control; NS: non-significant.

