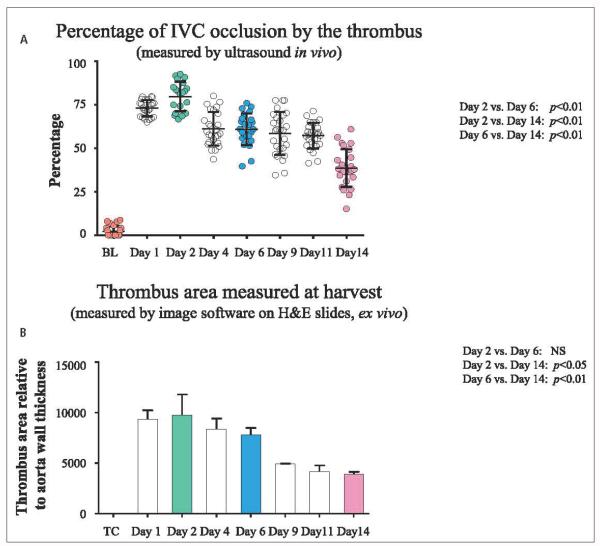
Figure 4. EIM and thrombus resolution.
A) Percentage of IVC occlusion by the thrombus measured in vivo by ultrasound. B) Thrombus area measured on H&E stained slides. Of note, both measurements showed maximum thrombus size at day 2 and a progressive and consistent thrombus size reduction over time. IVC: inferior vena cava; BL: baseline; TC: true control; H&E: Hematoxylin and eosin. NS: non-significant.

