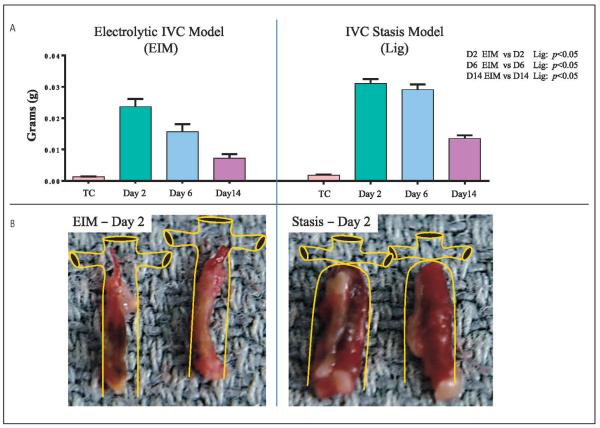
Figure 6. Thrombus weight comparisons between EIM and Stasis model.
A) Thrombus weights from both models showing significantly smaller thrombi in the EIM. B) Representative pictures of the thrombi harvested two days after thrombus induction in both models. IVC: inferior vena cava; EIM: electrolytic IVC model; Lig: ligation.

