
Fig. 3.
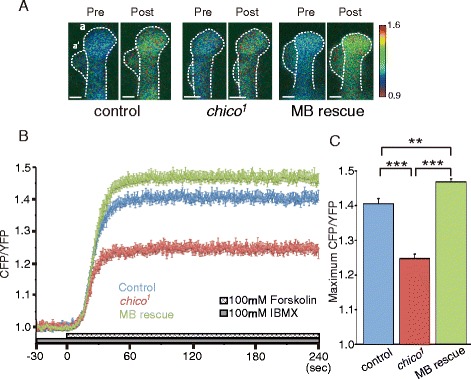
Adenylyl cyclase-dependent cAMP synthesis is reduced in chico 1 mutants. a Typical FRET images observed at the distal end of the α/α’ MB lobe 10 sec before (pre), and 60 sec after (post), forskolin stimulation in brains from control (UAS-Epac1-camps/+; OK107/+), chico 1 (chico 1 ; UAS-Epac1-camps/+; OK107/+) and MB-chico rescue (chico 1 ,UAS-chico/chico 1 ; UAS-Epac1-camps/+; OK107/+) flies. A shift towards red indicates an increased CFP/YFP ratio and increased cAMP amounts. Scale bar, 10 μm. b Time course of FRET changes (CFP/YFP) during forskolin stimulation. c Summary of maximum FRET changes (maximum CFP/YFP) upon forskolin stimulation. N = 14 for control lines, N = 13 for chico 1 mutants and MB rescue lines. *** P < 0.001, and ** P < 0.01. Data are shown as means ± SEM