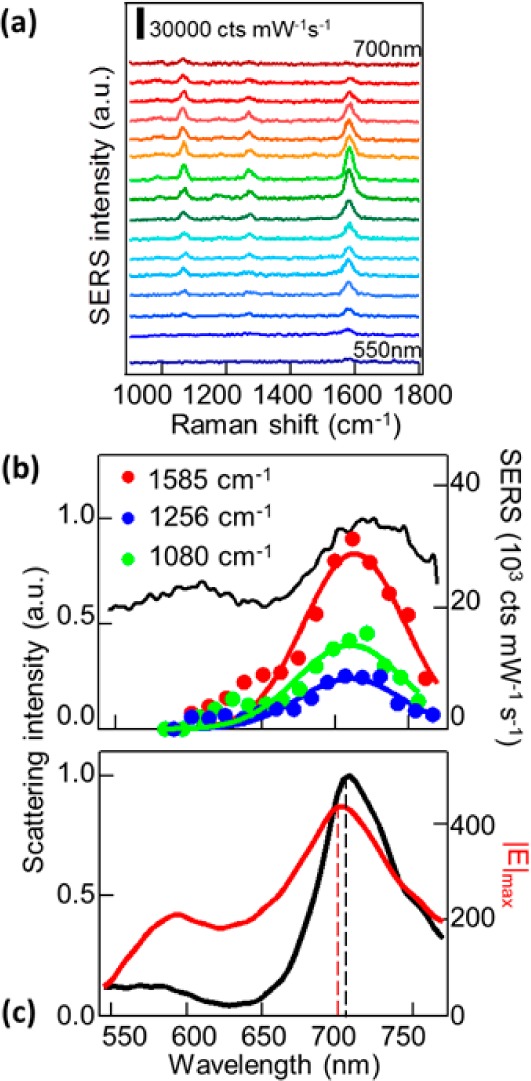
Figure 2.

(a) SERS spectra from a single 60 nm nanoparticle tuning the excitation laser from λp = 550 to 700 nm in 10 nm steps. (b) Extracted SERS intensity of three TPT Raman peaks vs SERS peak (outgoing) wavelength, compared to the normalized scattering spectrum (black) of the same single gold NPoM (lines show Gaussian fits). (c) FDTD simulations of scattering (black) and maximum near-field (red) for a 60 nm gold NPoM placed on a gold mirror.
