Fig. 3.

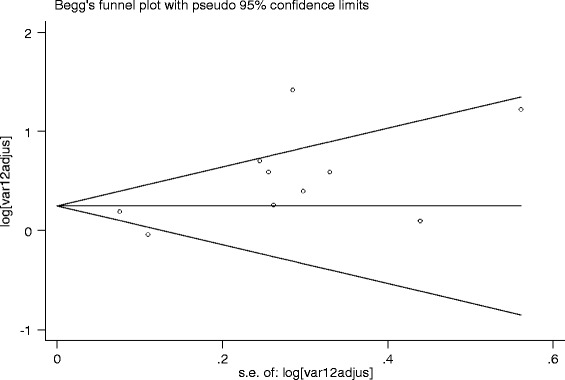
Begg’s funnel plot with 95 % confidence limit; the horizontal line in the funnel plot indicates the natural logarithms of the effect estimate, while the sloping lines indicate the expected 95 % confidence intervals

Begg’s funnel plot with 95 % confidence limit; the horizontal line in the funnel plot indicates the natural logarithms of the effect estimate, while the sloping lines indicate the expected 95 % confidence intervals