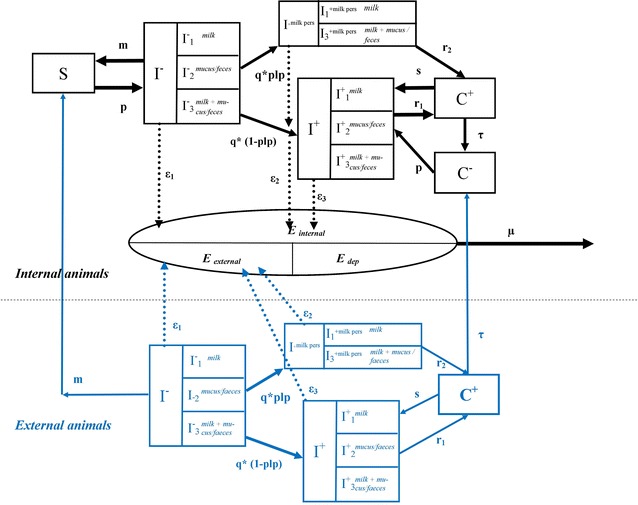
Figure 2.

Flow diagram describing the intra-herd spread of C. burnetii in a dairy cattle herd. The diagram describes the health statuses of cows and transitions between these statuses, and environmental bacterial load of the herd (adapted from [10]). The blue section represents the infection dynamics of external animals, while the black section represents internal animals. S: susceptible, non-shedder cows without antibodies, I −: shedder cows without antibodies, I +: shedder cows with antibodies, I milk pers: shedder cows with antibodies shedding in milk in a persistent way, C +: non-shedder cows with antibodies, and C −: non-shedder cows without antibodies which were infected and had antibodies in the past. I − and I + cows are in the shedding route category 1 if they shed in milk only, 2 if they shed in vaginal mucus/faeces only, and 3 if they shed in milk and vaginal mucus/faeces. I milk pers cows are in the shedding category 1 if they shed in milk only, and 3 if they shed in milk and vaginal mucus/faeces. E represents the force of infection related to the bacterial contamination of the environment. E local corresponds to the part of the force of infection due to internal animals, whereas E external is due to external animals and E dep is due to bacteria deposited from other infectious herds by airborne transmission. ε1, ε2 and ε3 are the quantities of contributions to E during a time step by cows in statuses I −, I +, and I milk pers., respectively. These quantities are the sum of all quantities of bacterial load shed by all the shedders through all the shedding routes and reaching the environment of the herd. Details of the shedding levels and the proportions of cows shedding through different routes are given in Table 2. Description and values of the parameters used are given in Table 1.
