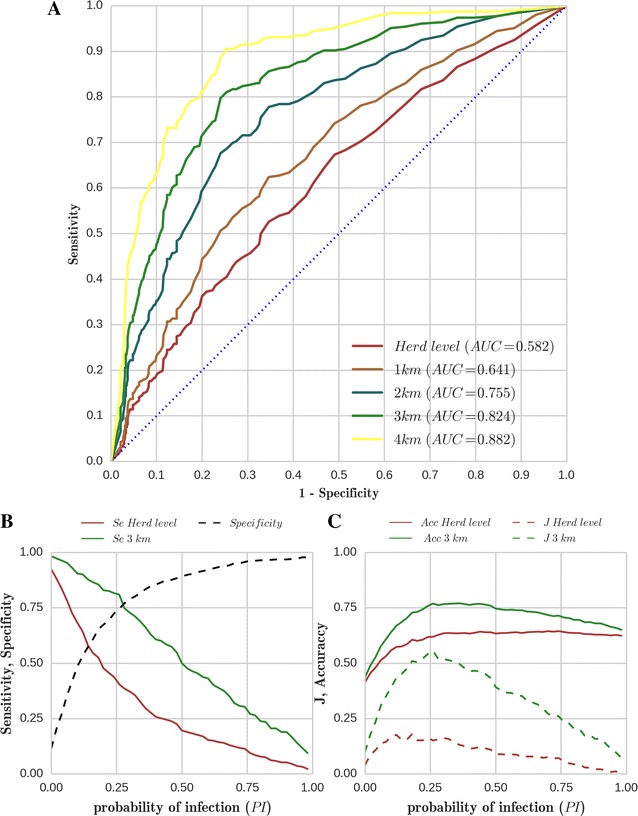
Figure 4.

Receiver operating characteristic (ROC) analysis of model predictions. ROC analysis (data are the reference) for the simulated probability of infection (PI) by C. burnetii after 1 year of inter-herd spread, for herds initially susceptible. (A) ROC curves for herd level analysis and neighbourhoods of 1, 2, 3, 4 km. The area under the curve (AUC) for each analysis is indicated in the legend. (B, C) Variation of the four indicators [Sensitivity (Se), Specificity (Sp), Accuracy (Acc), Youden Index (J)] used for building the three criteria [Se = Sp, max(Acc), max(J)] to optimise the cut-off of PI for the classification of herds as positive and negative. Calculations were performed at herd level and for a neighbourhood of 3 km. Model Sp was assumed to be identical over the different neighbourhoods and thus is shown as a single line.
