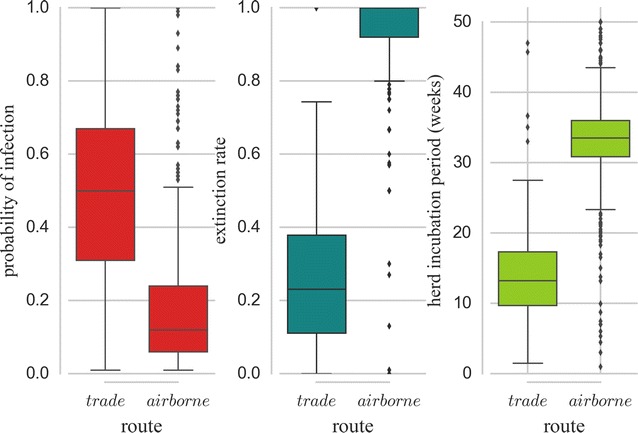
Figure 8.

Distribution of probability of infection (PI), extinction rate, and herd incubation period. Distribution of simulated PI, extinction rate, and time before generation of the first infection after exposure to the cause of infection in C. burnetii newly infected herds (one year of simulated infection dynamics) by cattle trade and airborne transmission. Each box contains values between the first and the third quartiles. Horizontal lines outside boxes correspond to the first quartile −1.5× interquartile range and the third quartile +1.5× interquartile range. Horizontal lines within the boxes correspond to medians.
