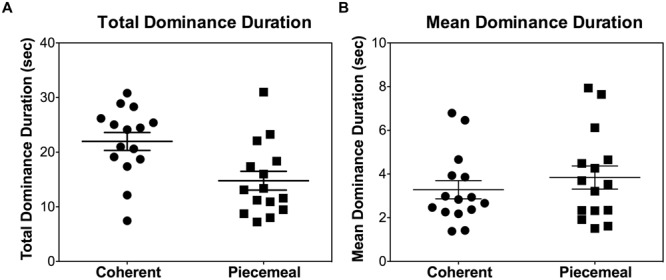
FIGURE 3.

Individual differences in (A) total dominance duration per trial (40 s) and (B) mean dominance duration for each of the participants during the placebo session, collapsing the stimulus types and measurement times. Each symbol represents one individual.
