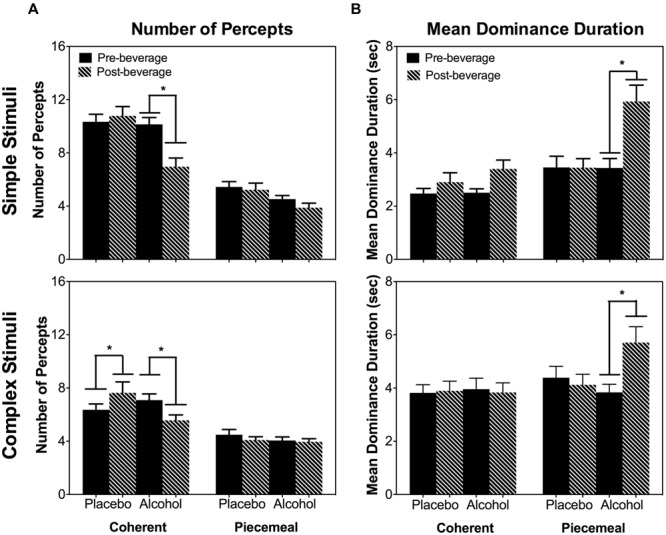
FIGURE 5.

The number of percepts (A) and mean dominance duration (B) measured at Pre- and Post-beverage for Placebo and Alcohol sessions for the two stimulus types, simple stimuli (top), and complex stimuli (bottom). Error bars are ±SEM. ∗p < 0.0125 for paired comparisons between pre- and post-beverage measurements in the same session.
