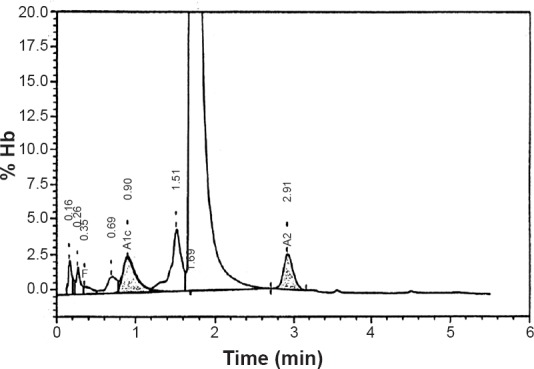
Fig. 3.

Elution haemoglobin chromatogram of patient II-3 specimen on Bio-Rad Variant V HPLC System. Time (min) represents the retention time in minutes for each fraction to elute; % Hb represents the percentage of haemoglobin in the elution peak. The retention time for each fraction is shown with the peak. HbA2 (2.6%) was eluted at a retention time of 2.91, HbF (0.5%) at a retention time of 0.35 min. The two earliest peaks of retention time 0.16 and 0.26 min correspond to HbA1a and HbA1b, respectively.
