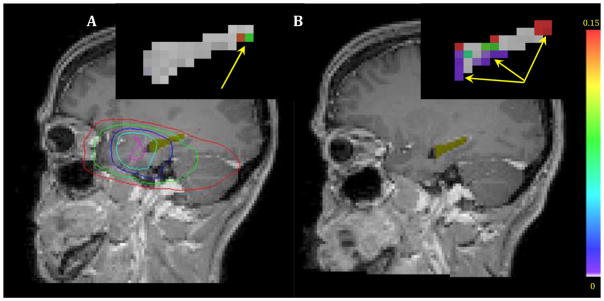
Fig. 3.
Hippocampi (yellow color) and zoomed and color-coded Ktrans maps overlaid on T1-weighted images pre-RT (A) and 1-month post-RT (B). The planned isodose curves, 5 (red), 10 (green), 20 (blue), 30 (cyan) and 40Gy (dark pink), are overlaid on the pre-RT image. Only a few voxels have Ktrans values greater than zero pre-RT (colored voxels pointed by yellow arrows) (A). The BBB permeability increased 1-month post-radiation (colored voxels pointed by yellow arrows) (B).

