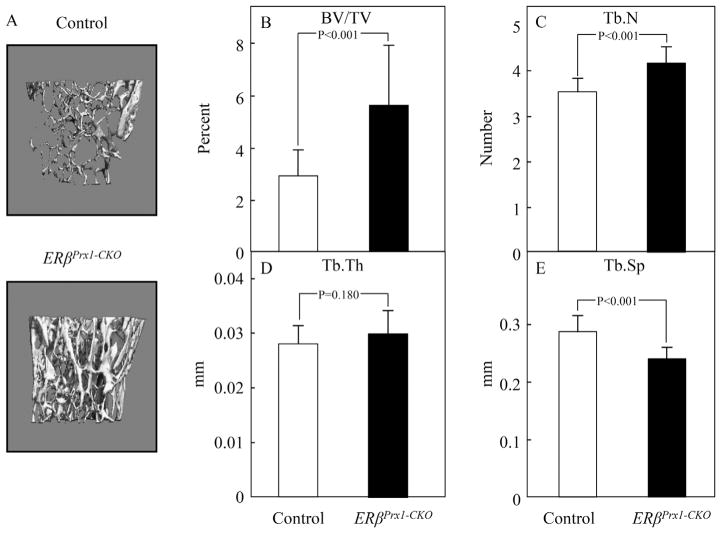
Fig. 2.
Trabecular parameters by μCT analyses in 12-week-old ERβPrx1–CKO mice. (A) Representative reconstructed images of distal femur trabecular bone in 12-week-old control or ERβPrx1–CKO mice. Changes in (B) bone volume to tissue volume (BV/TV), (C) trabecular number (Tb.N), (D) trabecular thickness (Tb.Th), and (E) trabecular separation (Tb.Sp) (n = 16 per group).

