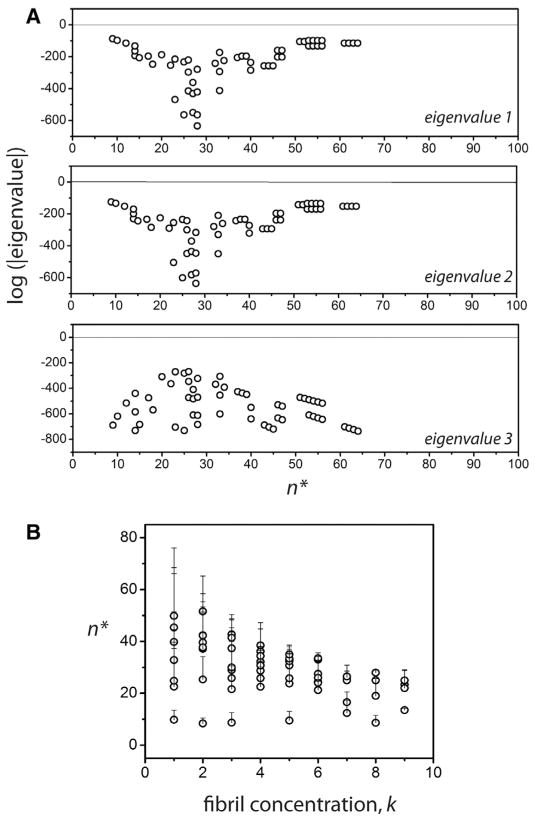
Fig. 2.
Prediction of n* by stability analysis. (A) Logarithm of the absolute values of real parts of the three eigenvalues of the perturbed system Eq. (7)–(9). The graph shows the eigenvalues only when all three values are simultaneously negative, suggesting linear stability. The n* values corresponding to the open circles are the allowable values for the nucleation size. (B) The variations in the n* as a function of fibril concentration index k, where the concentration is taken to be Pe = 10−k. Note that for any given value of k, fibril size, several n*’s are mathematically permissible, indicated by the error bars in the plot.

