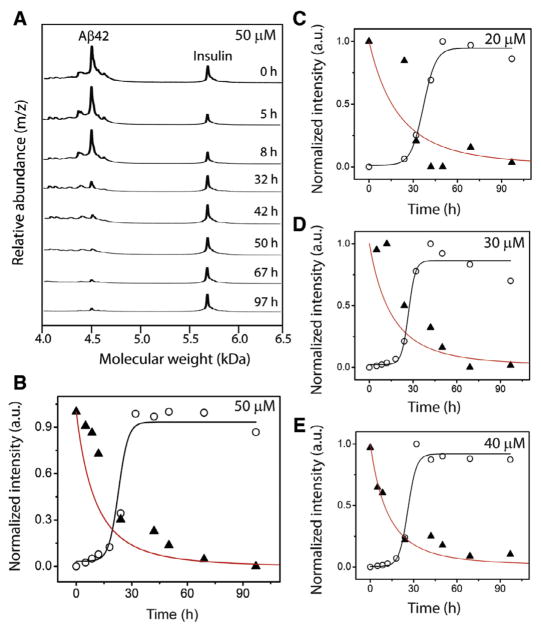
Fig. 6.
Monomer depletion data along with simulation overlap. (A) Analysis of Aβ aggregation (50 μM) shown in Fig. 3A by MALDI-ToF mass spectrometry containing an internal standard, insulin at the indicated times of incubation. (B–E) Normalized ThT intensities (○) along with quantitative monomer depletion data obtained from MALDI-ToF (▲). Black line is the sigmoidal fit from the detailed simulation to the data points shown in Fig. 3A. The red line is monomer depletion data obtained from detailed simulation. (For interpretation of the references to color in this figure legend, the reader is referred to the web version of this article.)

