
Figure 2. ShATF4-injected mice display spatial long-term memory deficits and memory inflexibility.
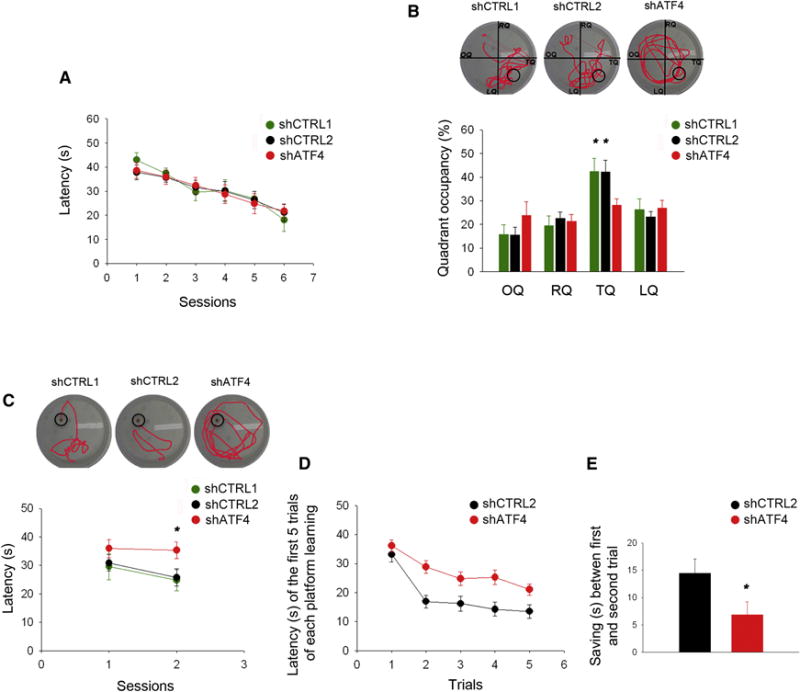
(A) Latency in the training phase of the standard Morris water maze test plotted against number of sessions. No difference in the learning capacity is detected between shCTRL1-, shCTRL2- and shATF4-injected animals (shCTRL1 n=10, shCTRL2 n=12, shATF4 n=9).
(B) Percentage of time spent in each quadrant of the pool during the probe trial (OQ, opposite quadrant; RQ, right quadrant; TQ, target quadrant; LQ, left quadrant). ShATF4-injected mice spend significantly less time exploring the target quadrant compared to the shCTRL1-, and shCTRL2-injected animals (shCTRL1 n=10, shCTRL2 n=12, shATF4 n=9).
(C) Latency in the re-training phase of the reversal-learning test is plotted against session number. ShATF4-injected mice take significantly more time to reach the new platform position compared to shCTRL1- and shCTRL2-injected animals (shCTRL1 n=10, shCTRL2 n=12, shATF4 n=9).
(D) Latency of the first 5 trials of new platform training in the Delayed Matching to Place task. Values are average latencies obtained from the last two training sessions (the third and the fourth platform locations). ShATF4-injected mice take significantly more time to learn new platform positions compared to shCTRL1- and shCTRL2-injected animals (shCTRL2 n=8, shATF4 n=13).
(E) The decrease in latency (saving time) between the first and second trial of each session in the Delayed Matching to Place task. Values are average saving times from the last two training sessions, i.e., the third and the fourth platform locations (shCTRL2 n=8, shATF4 n=13).
All data are expressed as mean ± SEM (* p<0.05).