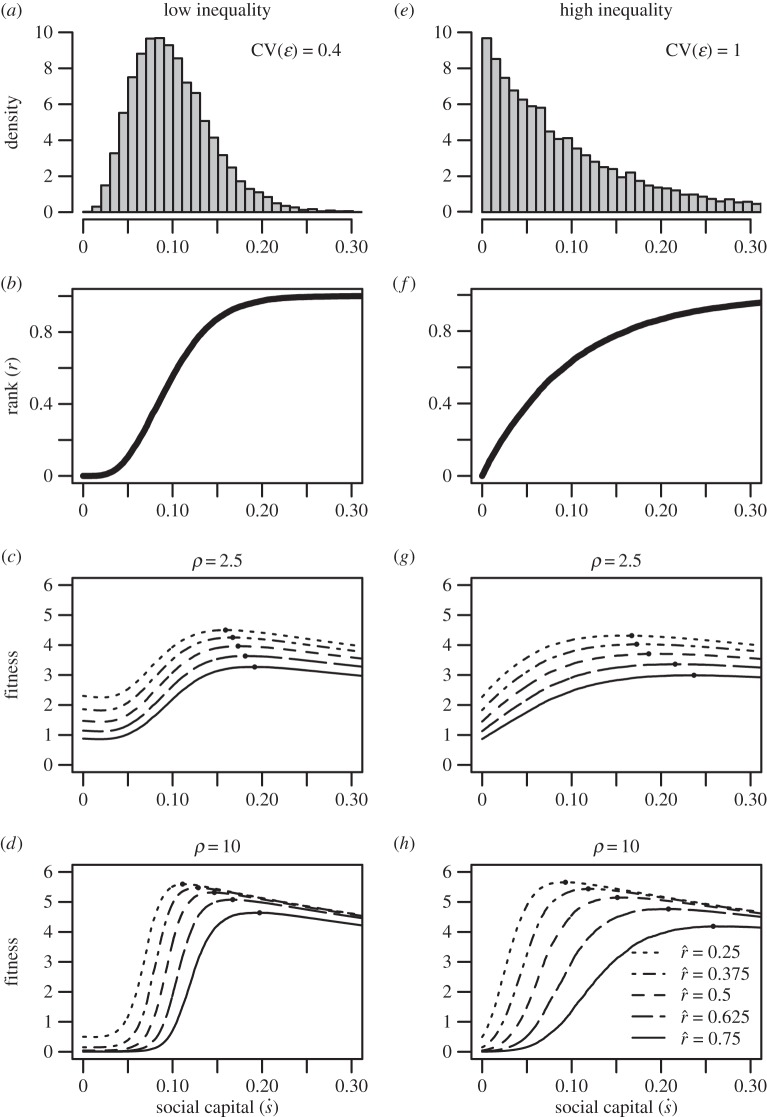
Figure 1.
An illustration of the effect of ecological parameters on the core mechanics of the model. The left-hand column represents conditions of lower inequality in the inputs to social rank (the distribution in panel (a)), while the right-hand column represents conditions of higher inequality (the distribution in panel (e)). Panels (b,f) indicate the rank achieved for a given level of investment in social capital. Panels (c,d,g,h) plot parental fitness as a function of investment in social capital given different values for the inflection point ( , varying across the solid and dashed lines) and slope (ρ, varying across panels) of the effect-of-social-capital function. Solid black points indicate the optimal (fitness-maximizing) levels of investment in social capital.

