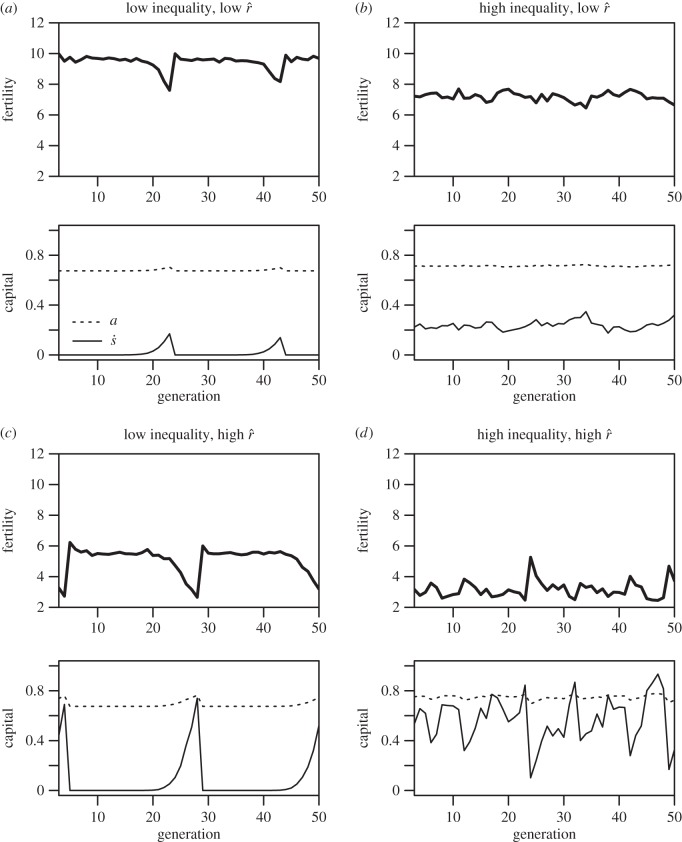
Figure 3.
(a–d) Dynamics of fertility and investment in offspring quality through time in four different ecologies. The thick solid line plots mean fertility, the dotted line plots mean investment in survival-and-productivity capital (a), while the thin solid line plots mean investment in social capital ( ). The left-hand column represents lower inequality in the inputs to status (CV(ɛ) = 0.4), whereas the right-hand column represents higher inequality (CV(ɛ) = 1). The top row represents a lower intensity of status competition (
 ), whereas the bottom row represents a higher intensity (
 ). ρ is held constant at 2.5 across ecologies.

