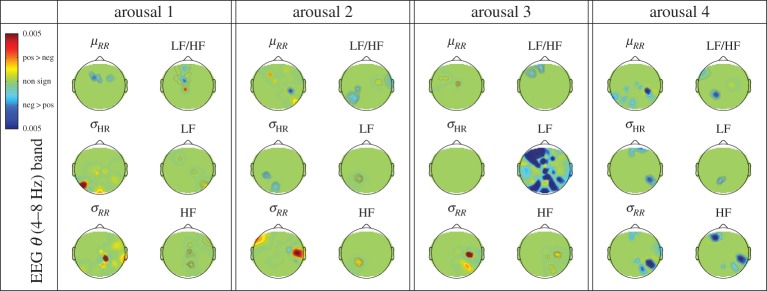
Figure 4.
p-Value topographic maps resulting from the statistical comparison (Wilcoxon non-parametric test) of MIC values between positive and negative elicitation. Results are shown for each HRV feature and the EEG θ frequency band, considering each arousal level. Green regions are associated with no significant difference between positiveand negative elicitations, whereas red/blue activations are associated with significant increase of the brain–heart coupling during the positive/negative elicitation sessions.

