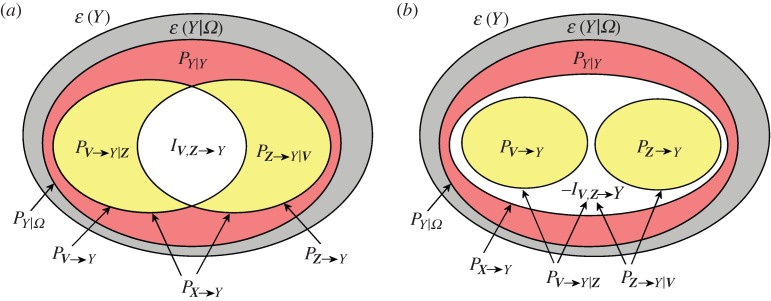
Figure 1.
Variance decomposition for the multivariate process Ω={Y,X}= {Y,V,Z}. The diagrams show how the variance of the target process Y (ε(Y), total area) is decomposed in an unpredictable part (ε(Y |Ω), grey area) plus a predictable part PY |Ω, denoting full predictability. The latter further splits in two parts evidencing the self-predictability of the target (PY |Y, red area) and the causal predictability from all sources to the target (PX→Y, yellow+white areas). Then, the overall causal predictability can be decomposed: (a) as the sum of the partial causal predictabilities (PV→Y |Z and PZ→Y |V, yellow) plus the interaction predictability (IZ,V→Y, white) in the case of redundancy or (b) as the sum of the causal predictabilities (PV→Y and PZ→Y, yellow) minus the interaction predictability (−IZ,V→Y, white) in the case of synergy. (Online version in colour.)

