
Figure 1.
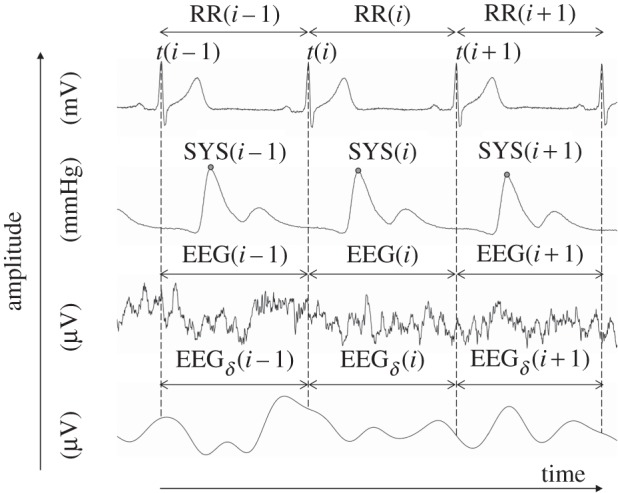
A visualization example of analysed raw data records and their extracted time series. Raw data are, from top to bottom: electrocardiogram, non-invasive continuous blood pressure, electroencephalogram (EEG) and EEG spectral band component (delta). RR(i) represents the beat-to-beat intervals; SYS(i) represents the maximum systolic blood pressure amplitude values over time in relation to the previous R-peak; EEG(i) and EEGδ(i) specified to time intervals of the EEG raw data (electrode: F4); and the EEG delta band time intervals (electrode: F4) in relation to RR(i).