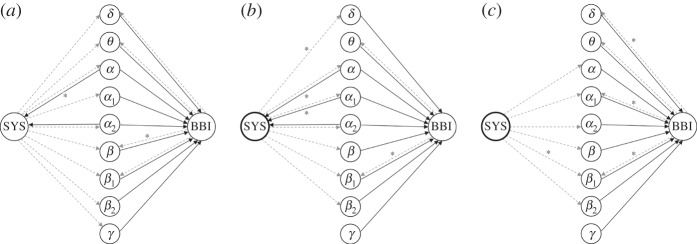
Figure 5.
Visualization of significant differences between patients suffering from paranoid schizophrenia (SZ) and healthy subjects (CO) with respect to the coupling strength (NSTPDC) between autonomic activity (BBI, SYS) and central spectral activity (PEEGband) for (a) the whole frontal area, (b) the left frontal area and (c) the right frontal area. Arrows indicate the coupling direction, where black solid lines indicate the direction from central spectral activity towards autonomic target variables. Grey dashed lines indicate the direction from the autonomic variables towards central spectral activity. Note that all arrows were highly significantly (p<0.00045) different between SZ and CO; otherwise, the arrows were indicated by *(p<0.01). BBI, beat-to-beat intervals; SYS, maximum systolic blood pressure amplitude values over time; PEEGband, the mean power in BBI-related EEG spectral band intervals.

