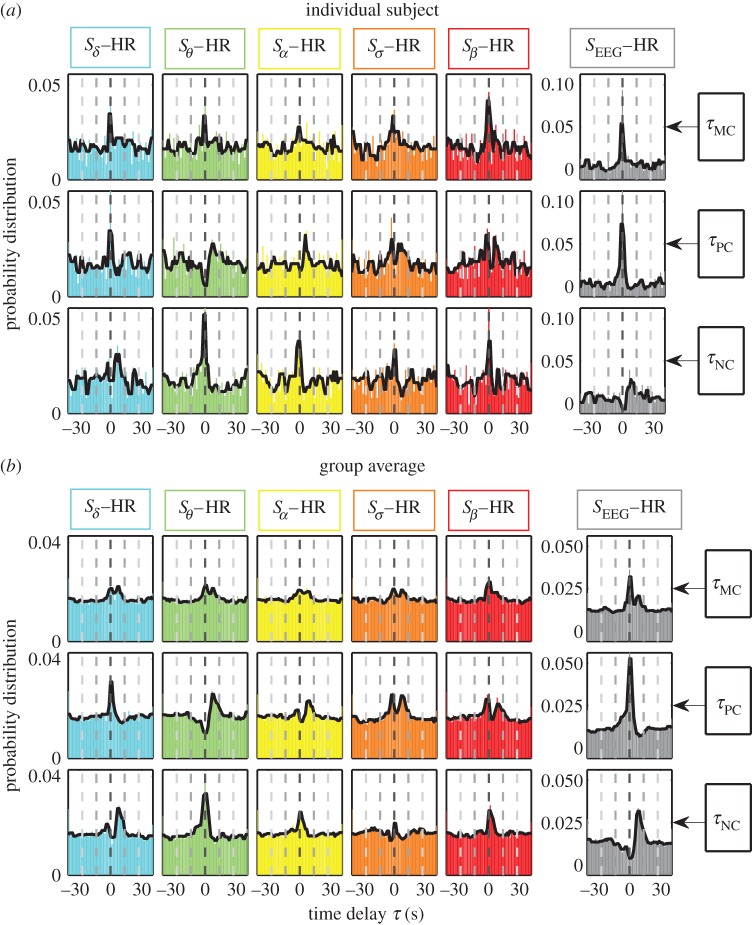
Figure 2.
Probability distribution profiles for maximum, positive and negative correlation time delays τMC, τPC and τNC: (a) for an individual subject and (b) for the group average of 34 healthy subjects representing the entire night-time sleep period. Solid black line in each panel is a moving average of the probability distribution (smoothed profile with 3 s moving window). The bin size for the time delay τ is 1 s. Similarity between the individual subject profiles and the group average profiles for each pair of brain rhythm–heart interaction indicates a universal mechanism underlying time delays in brain–heart communication. (Online version in colour.)

