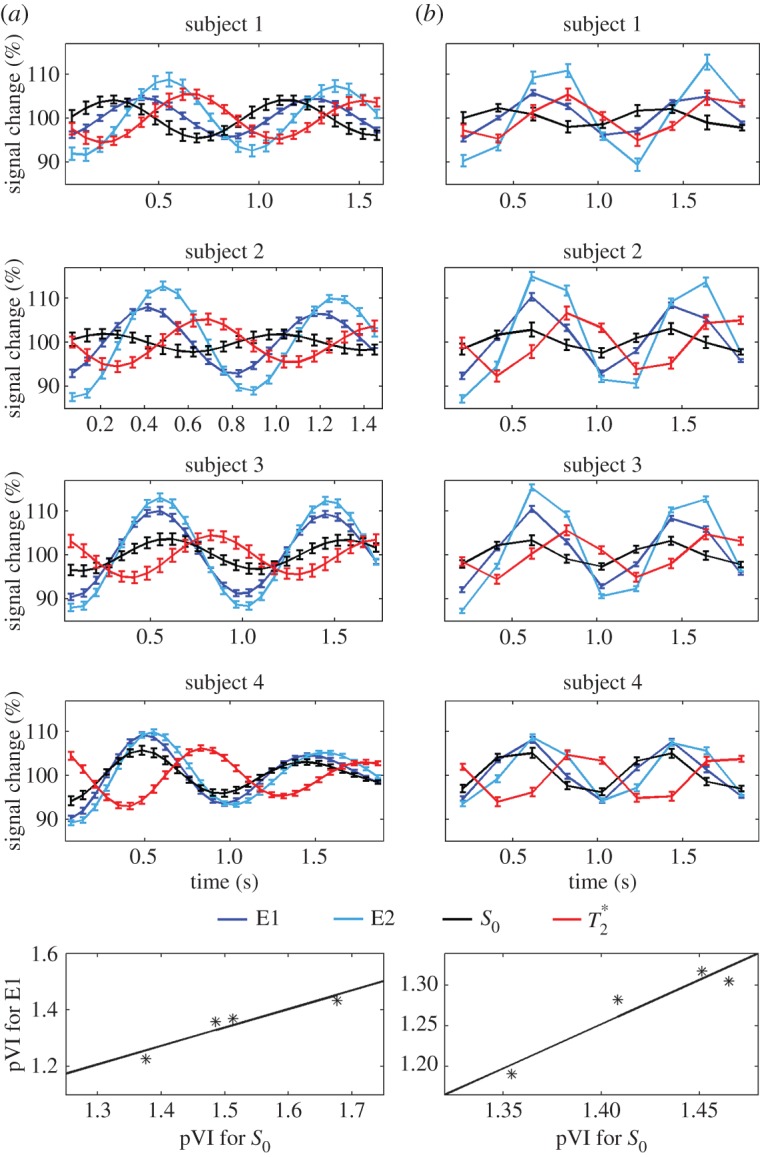
Figure 5.

On the origin of the MRI pulse waveform, scrutinizing S0 and possible  effects owing to physiological pulse waves (experiment 3). The cardiac MRI pulse waveform in the carotid arteries for four subjects and two different TRs, (a) TR=69 ms, (b) TR=205 ms, is shown in rows 1–4, respectively, for echo 1 (E1), echo 2 (E2), S0 and
  signals obtained from multi-echo EPI experiments. In the bottom row, for each subject the pVIsegment of the carotid arteries computed on E1 signals versus the pVIsegment computed on S0 signals is displayed. The MRI pulse waveform displayed changes in S0 signals as expected from theoretical predictions in the presence of pulsatility changes in blood volume. Interestingly,
  changes related to the phase of the cardiac cycles were also present, and, on average (s.e.) across subjects, lagged changes in S0 signals by 0.42±0.03 times the cardiac cycle (i.e. they were almost in anti-phase with S0 signals). The measured
  changes were compatible with pulsatile blood volume effects, because a blood volume increase was expected to decrease the voxel
  signal (note that
  is shorter in the carotid arteries than in neighbouring tissue) and at the same time increase the S0 signal (S0 is proportional to the total spin concentration). However, other pulsatile effects (although probably less likely, such as pulsatile fluctuations in deoxyhaemoglobin concentration) might have contributed as well to
  changes. Therefore, we tested (bottom panel) whether
  effects might introduce a bias across subjects for the estimation of the pVI in experiments using single-echo signals only, rather than S0 signals estimated from multi-echo experiments. This was not the case in our dataset, because the pVIsegment of the carotid arteries computed on S0 signals displayed a significant correlation across subjects (r=0.95, p<0.05 for both long and short TR, see bottom panel) with the pVIsegment of the carotid arteries computed on E1 signals. (Online version in colour.)
