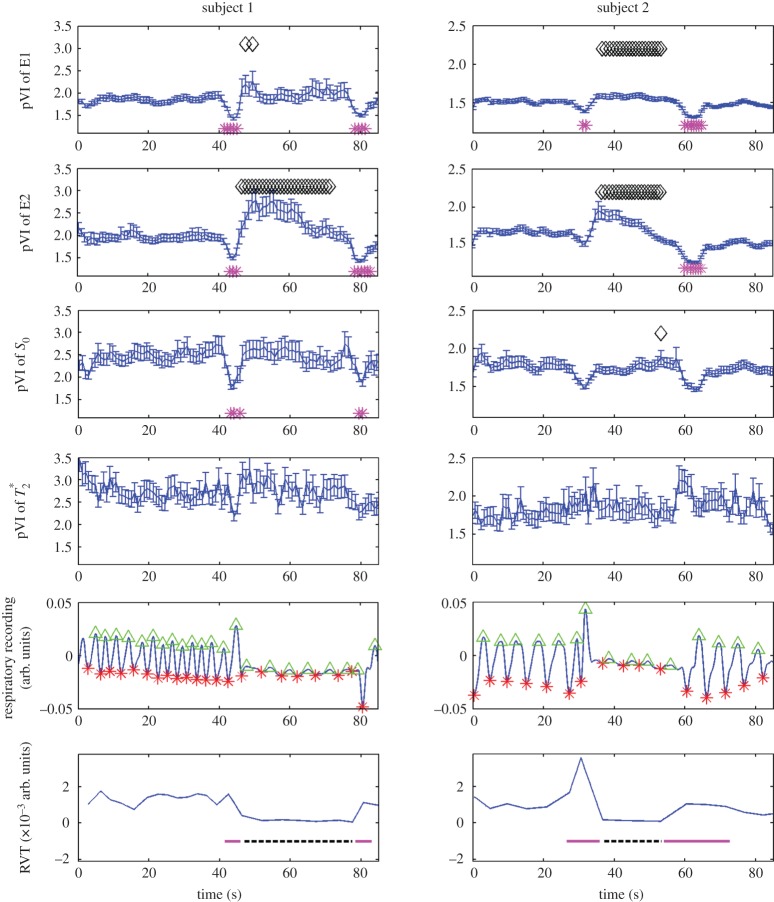
Figure 6.
ThepVI dynamics during a breath-holding challenge (experiment 4). The dynamics of pVIsegment of the carotid arteries during a breath-holding challenge are shown for two subjects and E1, E2, S0 and  signals (top four rows). We also show (fifth row) the respiratory chest recordings obtained simultaneously with the MRI acquisition (respiratory peaks and minima are indicated with green triangles and red asterisks, respectively), and the respiratory volume rate, RVT (a surrogate marker of minute ventilation, bottom row) computed from respiratory recordings. With respect to the first time-point during normocapnia, the pVI computed from E1 and E2 signals increased (black diamonds p<0.05) during breath-holding, concurrent with a decrease in RVT (black dashed line, bottom row), while it decreased (magenta asterisks p<0.05) during few seconds before and after breath-holding, concurrent with an increase in RVT (two magenta solid lines, bottom row). A trend of the same dynamics (with some time-points showing significant changes) was also present in the pVI computed from S0 signals. The pVI computed from
  signals did not change during the breath-holding challenge. These results provide a preliminary validation of the pVI as a biomarker of cerebrovascular compliance capable of detecting transient changes in the viscoelastic properties of the vessel walls in response to a breath-holding challenge. (Online version in colour.)

