
Figure 5.
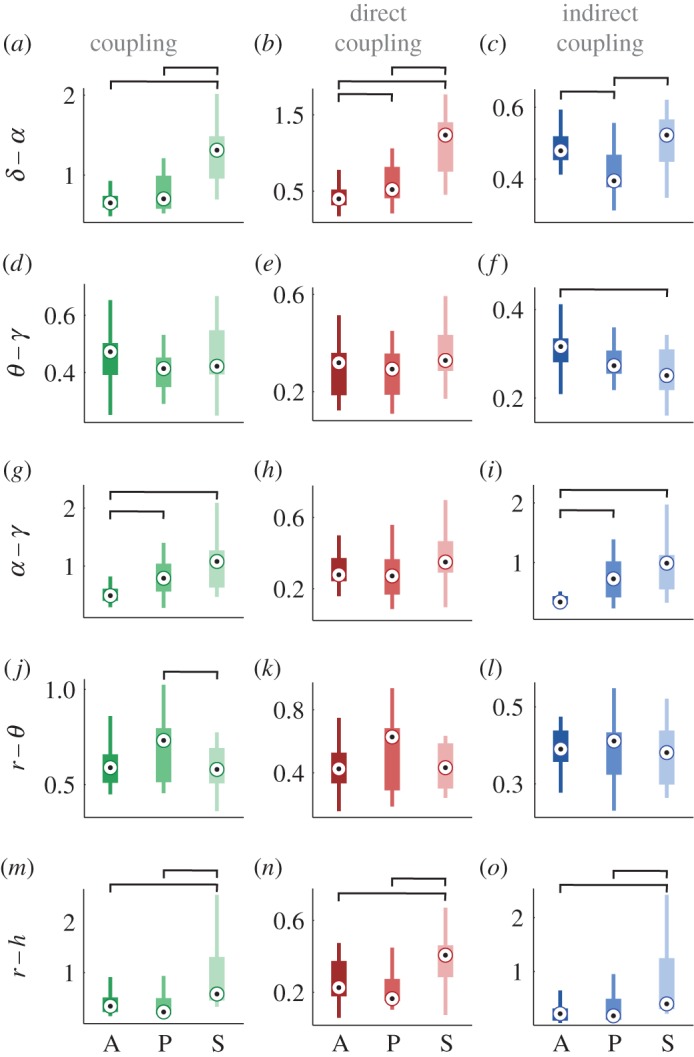
Anaesthesia-induced changes in coupling strength. Each boxplot shows the coupling strength distribution of a specific coupling relationship for the awakeness state indicated by the letter A (awake), P (propofol) or S (sevoflurane) on the abscissa. The coupling relationships are shown on the vertical axes, with each interaction as a separate row, including δ–α shown in (a–c), θ–γ (d–f), α–γ (g–i), r–θ (j–l) and r–h (m–o). The h–θ row is omitted because there were no significant changes. The columns correspond to the net, direct and indirect coupling components, respectively. The line connectors on the tops of individual panels indicate cases where the difference between two boxplot distributions was statistically significant (for statistical procedures see §2d). (Online version in colour.)