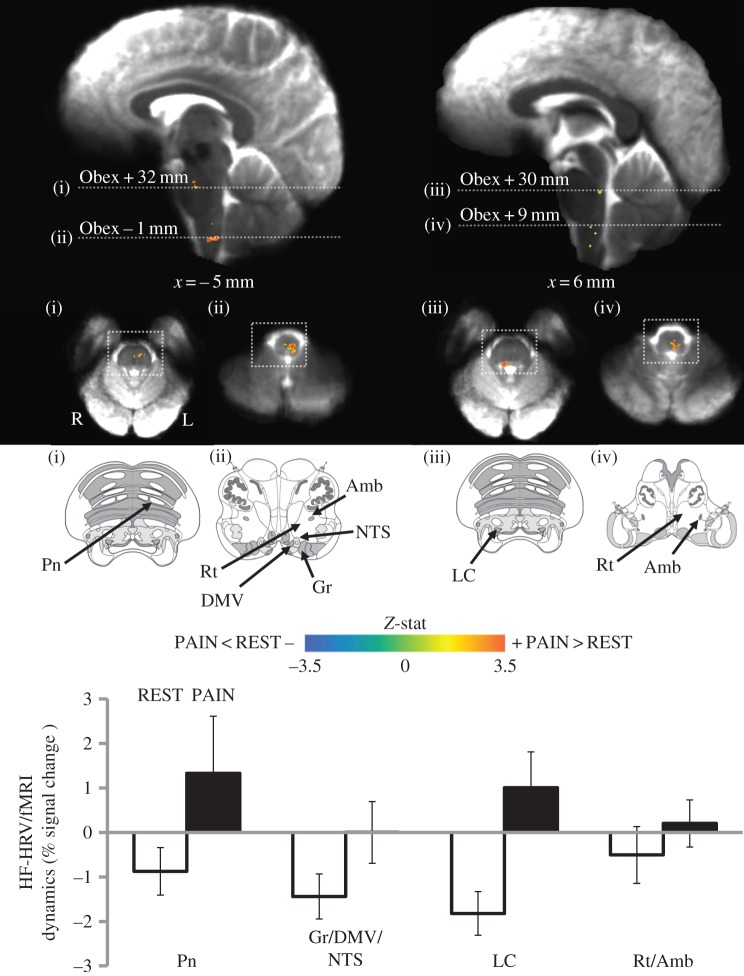
Figure 3.
Differential map (PAIN–REST) for the HF-HRV/fMRI analysis of the initial 2-min time window. Group maps are compared with graphical representations of brainstem nuclei from the Duvernoy atlas [31] (white squares indicate the atlas image correspondence on the functional maps). A significant difference between REST and PAIN conditions was found in pontine and medullary regions, including the locus coeruleus (LC) and nucleus of the solitary tract (NTS). Per cent signal change from the significant clusters shows a reduction in the negative correlation or a shift to positive correlation during PAIN. Bar plot error bars represent s.e.m.

