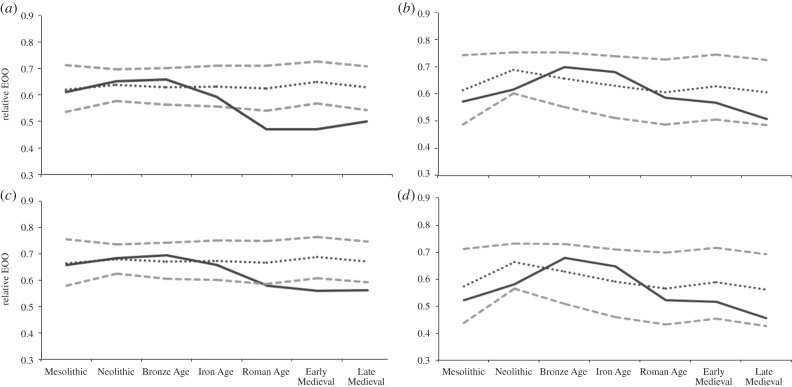
Figure 4.
Observed mean range and expected mean range based on bootstrap models across all time periods, for (a) species with body mass more than 100 kg, (b) species with body mass less than 100 kg, (c) herbivores and (d) carnivores. All calculations are on a relative scale. Grey dashed lines denote bootstrapped 95% CIs for geographical range extents; black dotted line denotes mean range estimates from all bootstrapped samples; solid black line denotes observed ranges.

