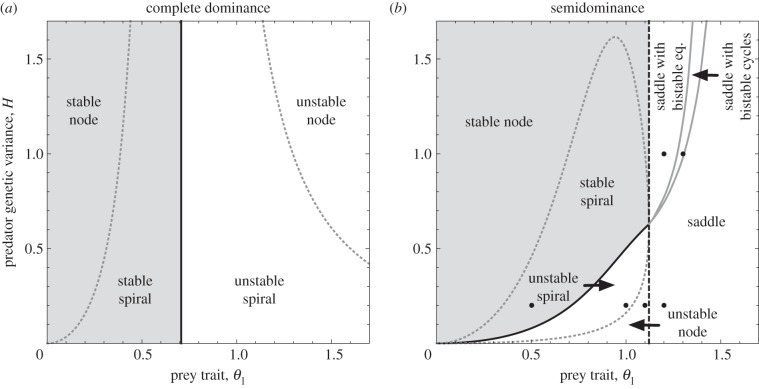
Figure 1.
Phase diagrams for the internal equilibrium of the two-dimensional evolutionary system. Horizontal axis is the prey trait (θ1) and vertical axis is the predator genetic variance (H). (a) Complete dominance (θ1 = θ2 =–θ3) and (b) semidominance (θ1 =–θ3 and θ2 = 0). Light grey regions: the stable internal equilibrium. White regions: the unstable internal equilibrium. Solid black line/curve: Hopf bifurcations. Dashed black line: a saddle-node bifurcation. Solid grey curves: Hopf bifurcations of the two additional interior equilibria and the condition for two bistable cycles to merge obtained by numerical simulations. Dashed grey curves: boundaries between nodes and spirals (real and complex eigenvalues, respectively). Black points in figure 1b indicate parameter values for figures 2 and 3.

