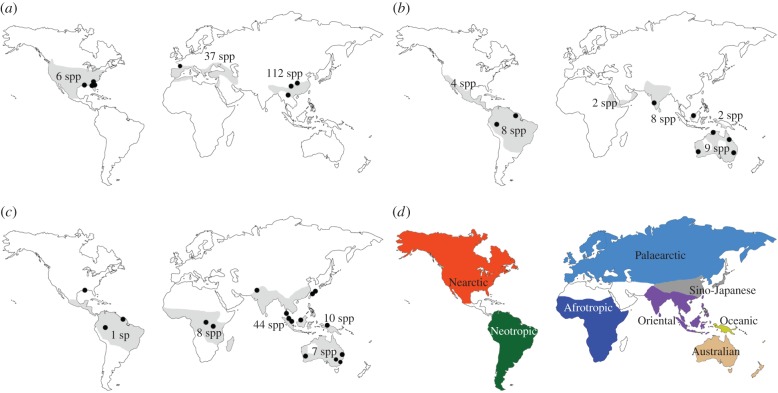
Figure 1.
Distribution map of (a) Reticulitermes, (b) Heterotermes and (c) Coptotermes. Light grey areas are the native range of each genus, black circles represent the sampling locations of the specimens used in this study, and species numbers are given as per Krishna et al. [1] and Scheffrahn et al. [16]. As C. formosanus was sampled from introduced populations, a few black circles occur outside the native range of Coptotermes. (d) Map of the main zoogeographic realms considered in this study [17]. White areas are regions from which no samples were analysed in this study.

