
Figure 1.
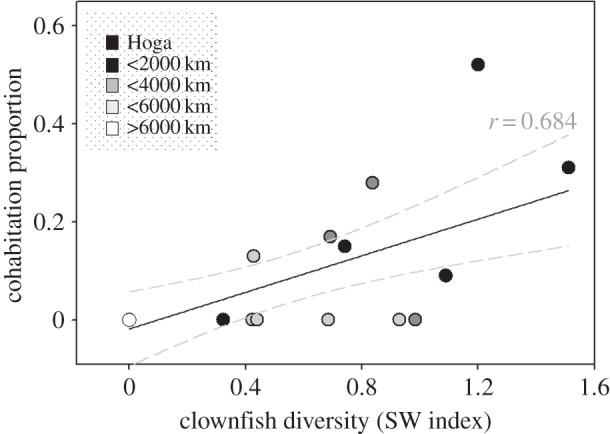
The relationship (r = 0.68, n = 20, p < 0.01) between the proportion of anemones that contained interspecific cohabiting clownfishes and clownfish diversity (S–W Index). Surveys were conducted between 2005 and 2014. The distance of each site from Hoga is illustrated by the shading of each point (see Legend). 95% confidence interval is shown (grey dashed lines).