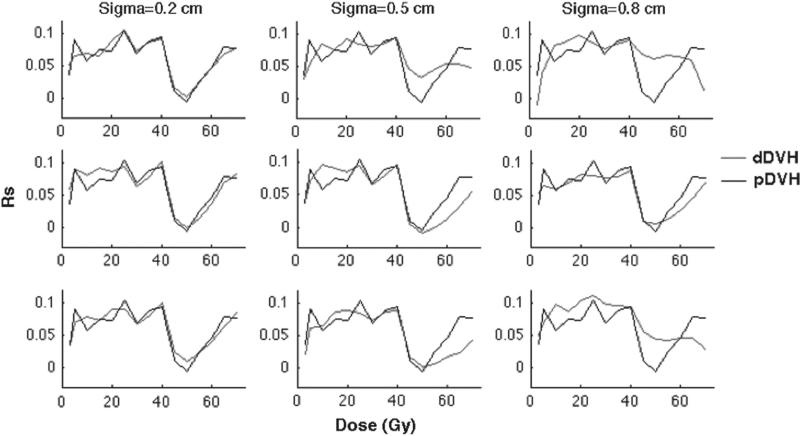
Figure 3.
The simulation of isotropic motion and the associations of the resulting dDVHs (red) and the pDVH (black) with rectal morbidity quantified by Spearman's rank correlation coefficient (Rs) plotted against the dose (Gy) for random (upper panel), systematic (middle panel) and combined random and systematic motion (lower panel) using σ of 0.2 (left), 0.5 (middle) and 0.8 (right) cm.

