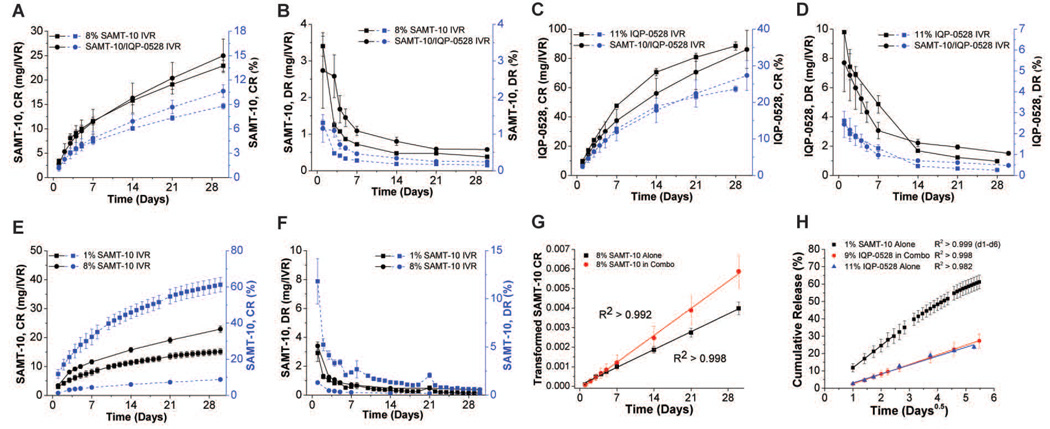
Figure 5.
(A) Cumulative release and (B) daily release rate profiles of SAMT-10, and (C) cumulative release and (D) daily release rate profiles of IQP-0528 in 25 mM acetate buffer (pH 4.2) containing Solutol® HS 15 (sink conditions) (N=3, mean ± SD). Comparison of (E) cumulative release and (F) daily release between 1% and 8% SAMT-10 single agent IVR. (G) Example linear regression of transformed cumulative release against time in order to determine scaled SAMT-10 diffusivities as described in Eqn. 3. (H) Example linear regression of cumulative release against the square-root-of-time to determine ARV diffusivities as described in Eqn. 2. In G and H, a linear regression of the mean data is shown as an example, where in reality fitting was performed on individual sample curves. Coefficients of determination (R2) were greater the value shown for all sample curves from the given IVR group.

