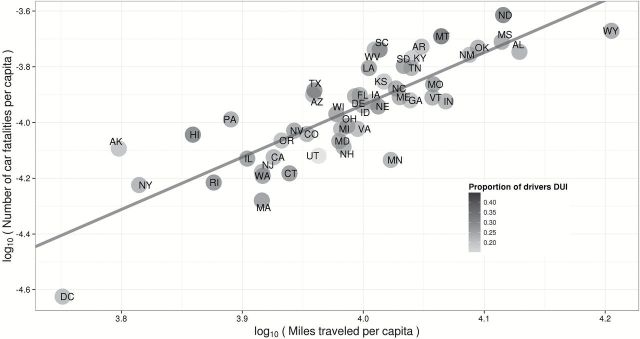
Figure 1.
Automobile fatalities, plotted against miles traveled. A high proportion (70%) of the variation in log risk (per year) of a fatal crash can be explained by the log of the average number of miles driven per year per person. (Data from National Highway Traffic Safety Administration, http://www-fars.nhtsa.dot.gov.) The shading indicates the fraction of fatalities where one or both drivers were found to be under the influence of alcohol.

